- Accessing the YGH Monitor
- YGH Monitor Layout and Panels
- 1. Header and App Version
- 2. Featured Stats
- 3. Image Exporter and Theme Setters
- 4. Live Monitor, Archive Viewer, Grand Checker Tabs
- Live Monitor Controls
- The Status Panel
- The Timing Panel
- Archive Viewer Controls
- Find An Eruption
- Get Data From
- Infrasound Viewer
- Infrasound Targets
- Seismic Viewer
- Seismic Traces
- Archive Viewer Tools
- Overview Window
- Creating Time Stamps and Measuring Durations
- Grand Checker (beta)
YGH Monitor App - Pt. 3: Use Cases
A living document showcasing examples of verified eruptions and their YGH traces
Published on: Thursday, 12 November 2026 at 00:55 UTC
YGH Monitor App - Pt. 2: How to Use the Tools
Instructions on how to navigate and use the YGH Monitor App for various forms of geyser gazing.
Published on: Saturday, 07 November 2026 at 00:55 UTC
YGH Monitor App - Pt. 1: Introduction
A new instrument in Yellowstone can be used for geyser gazing
Published on: Saturday, 07 November 2026 at 00:55 UTC
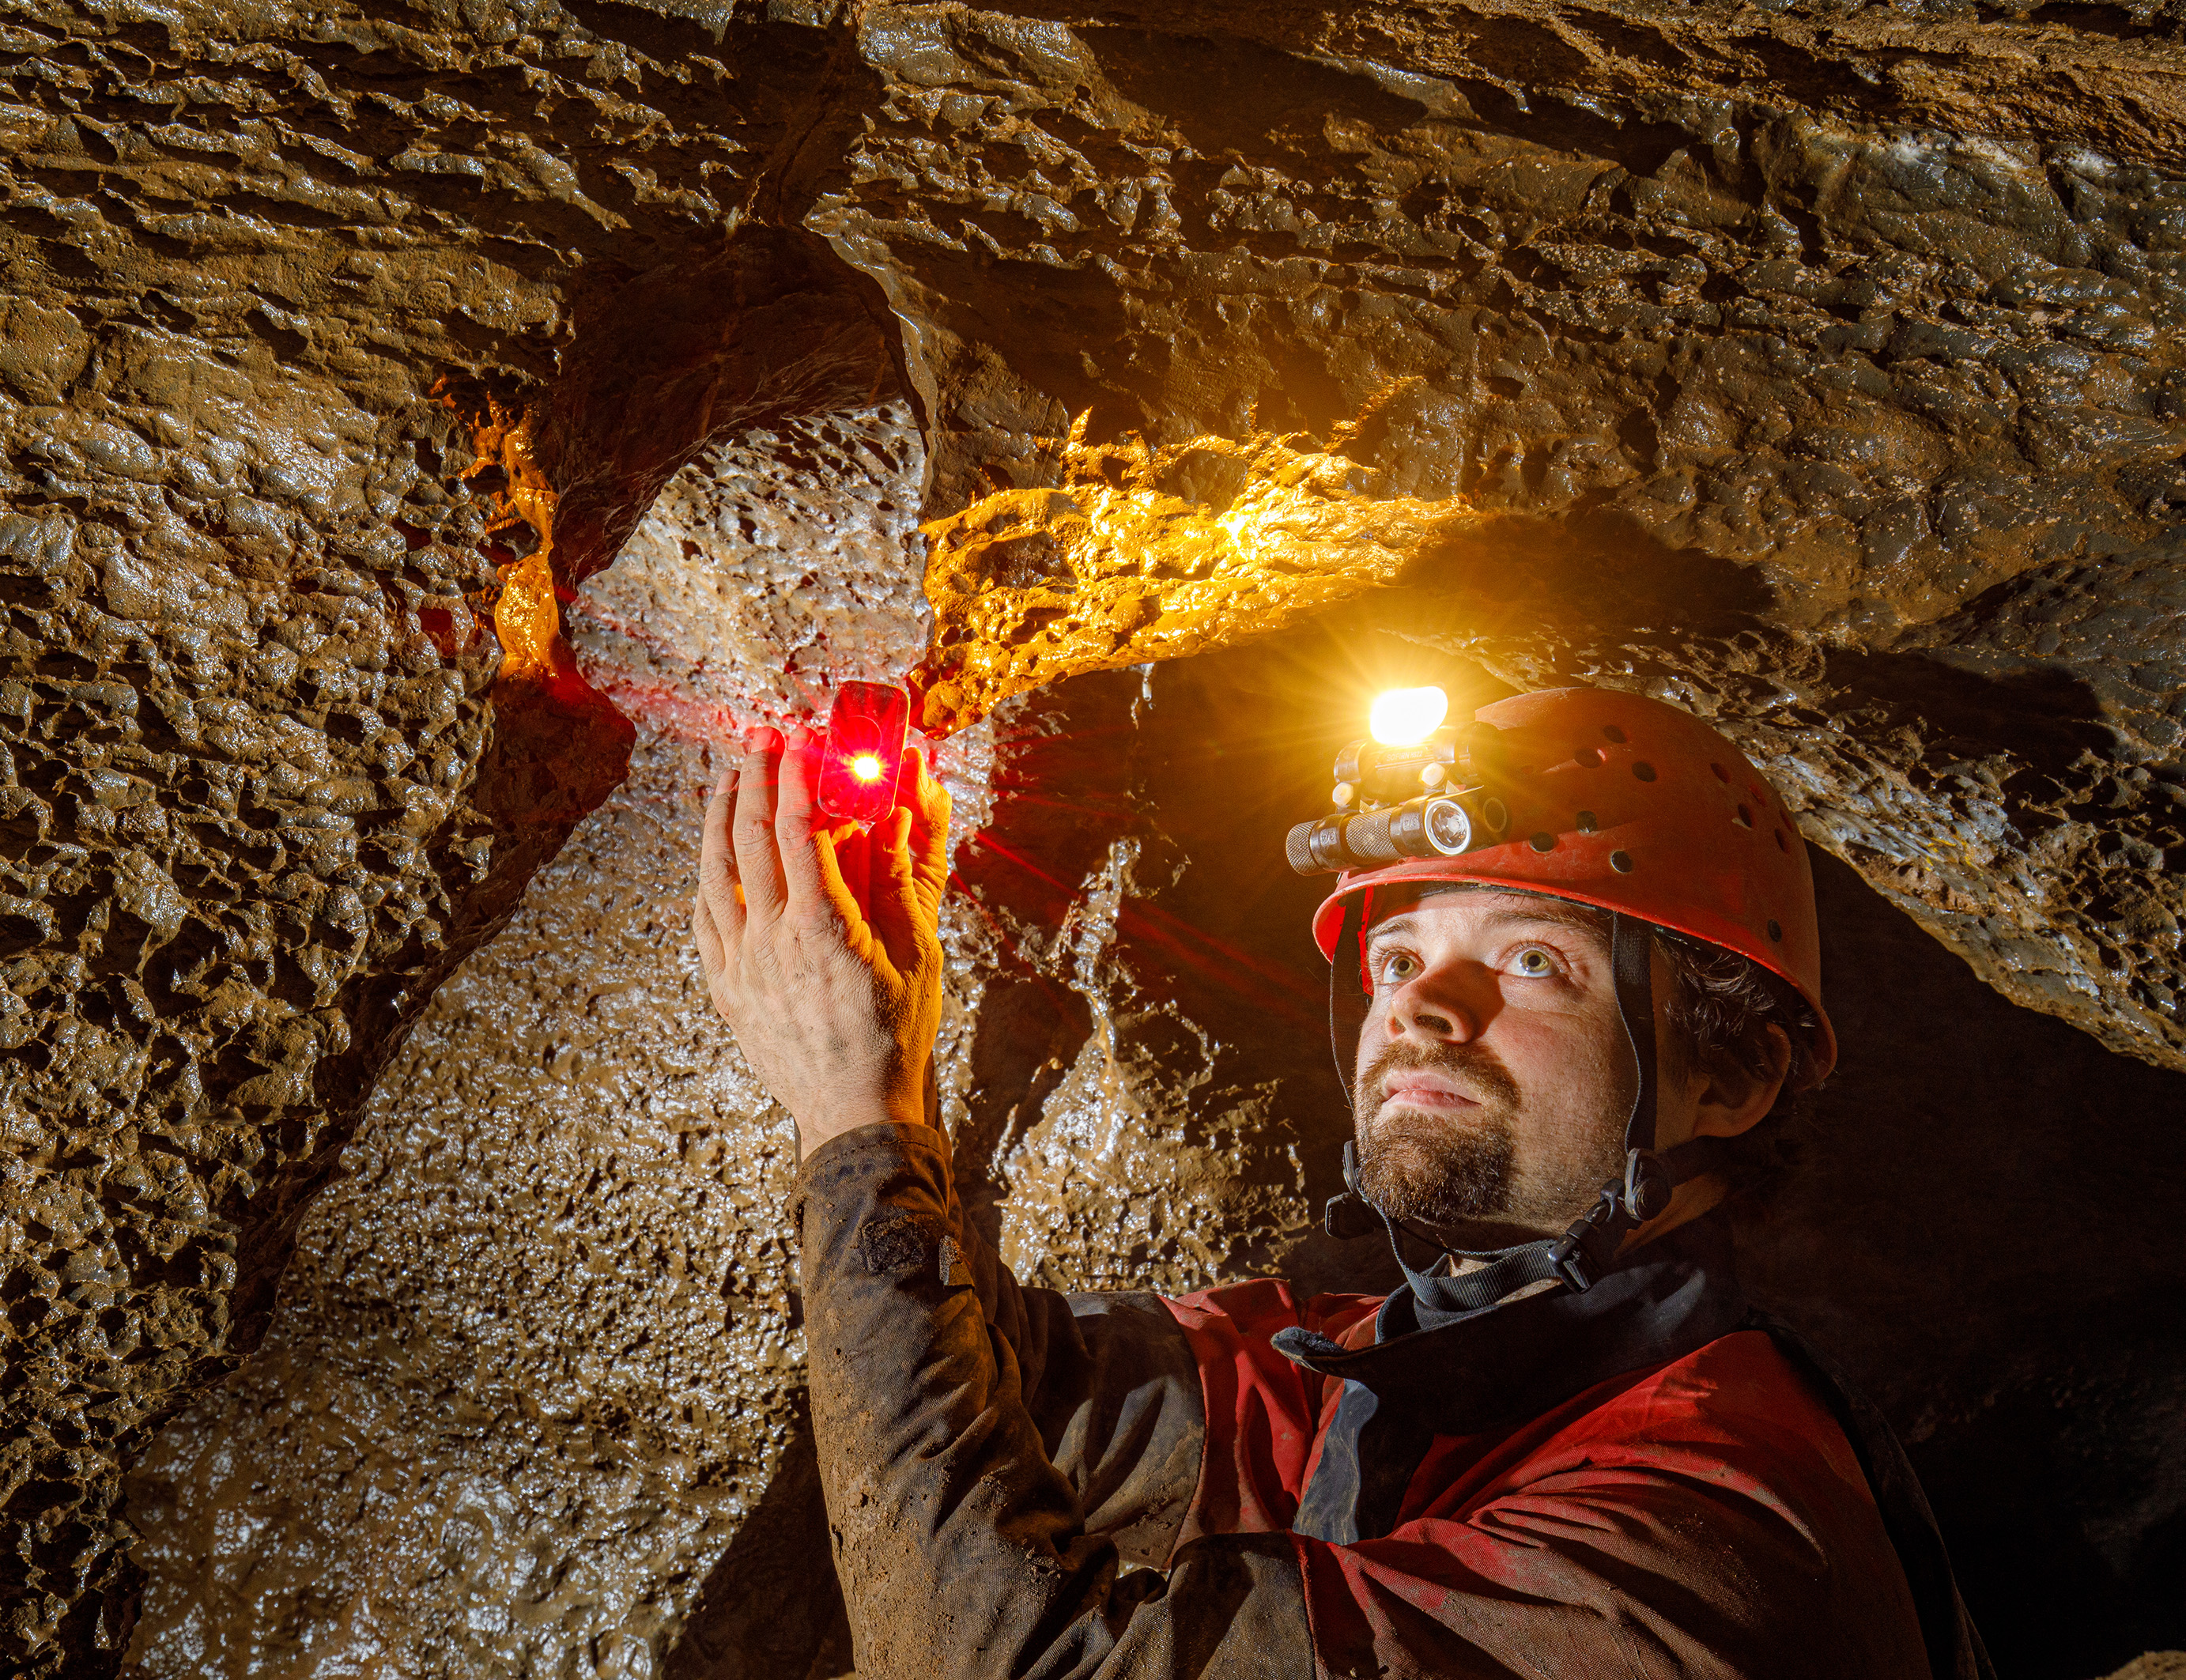
Sofirn's HS22 and SP40A Headlamps
For cavers, this is like having a sub-$150 Scurion
Published on: Wednesday, 17 December 2025 at 11:55 UTC
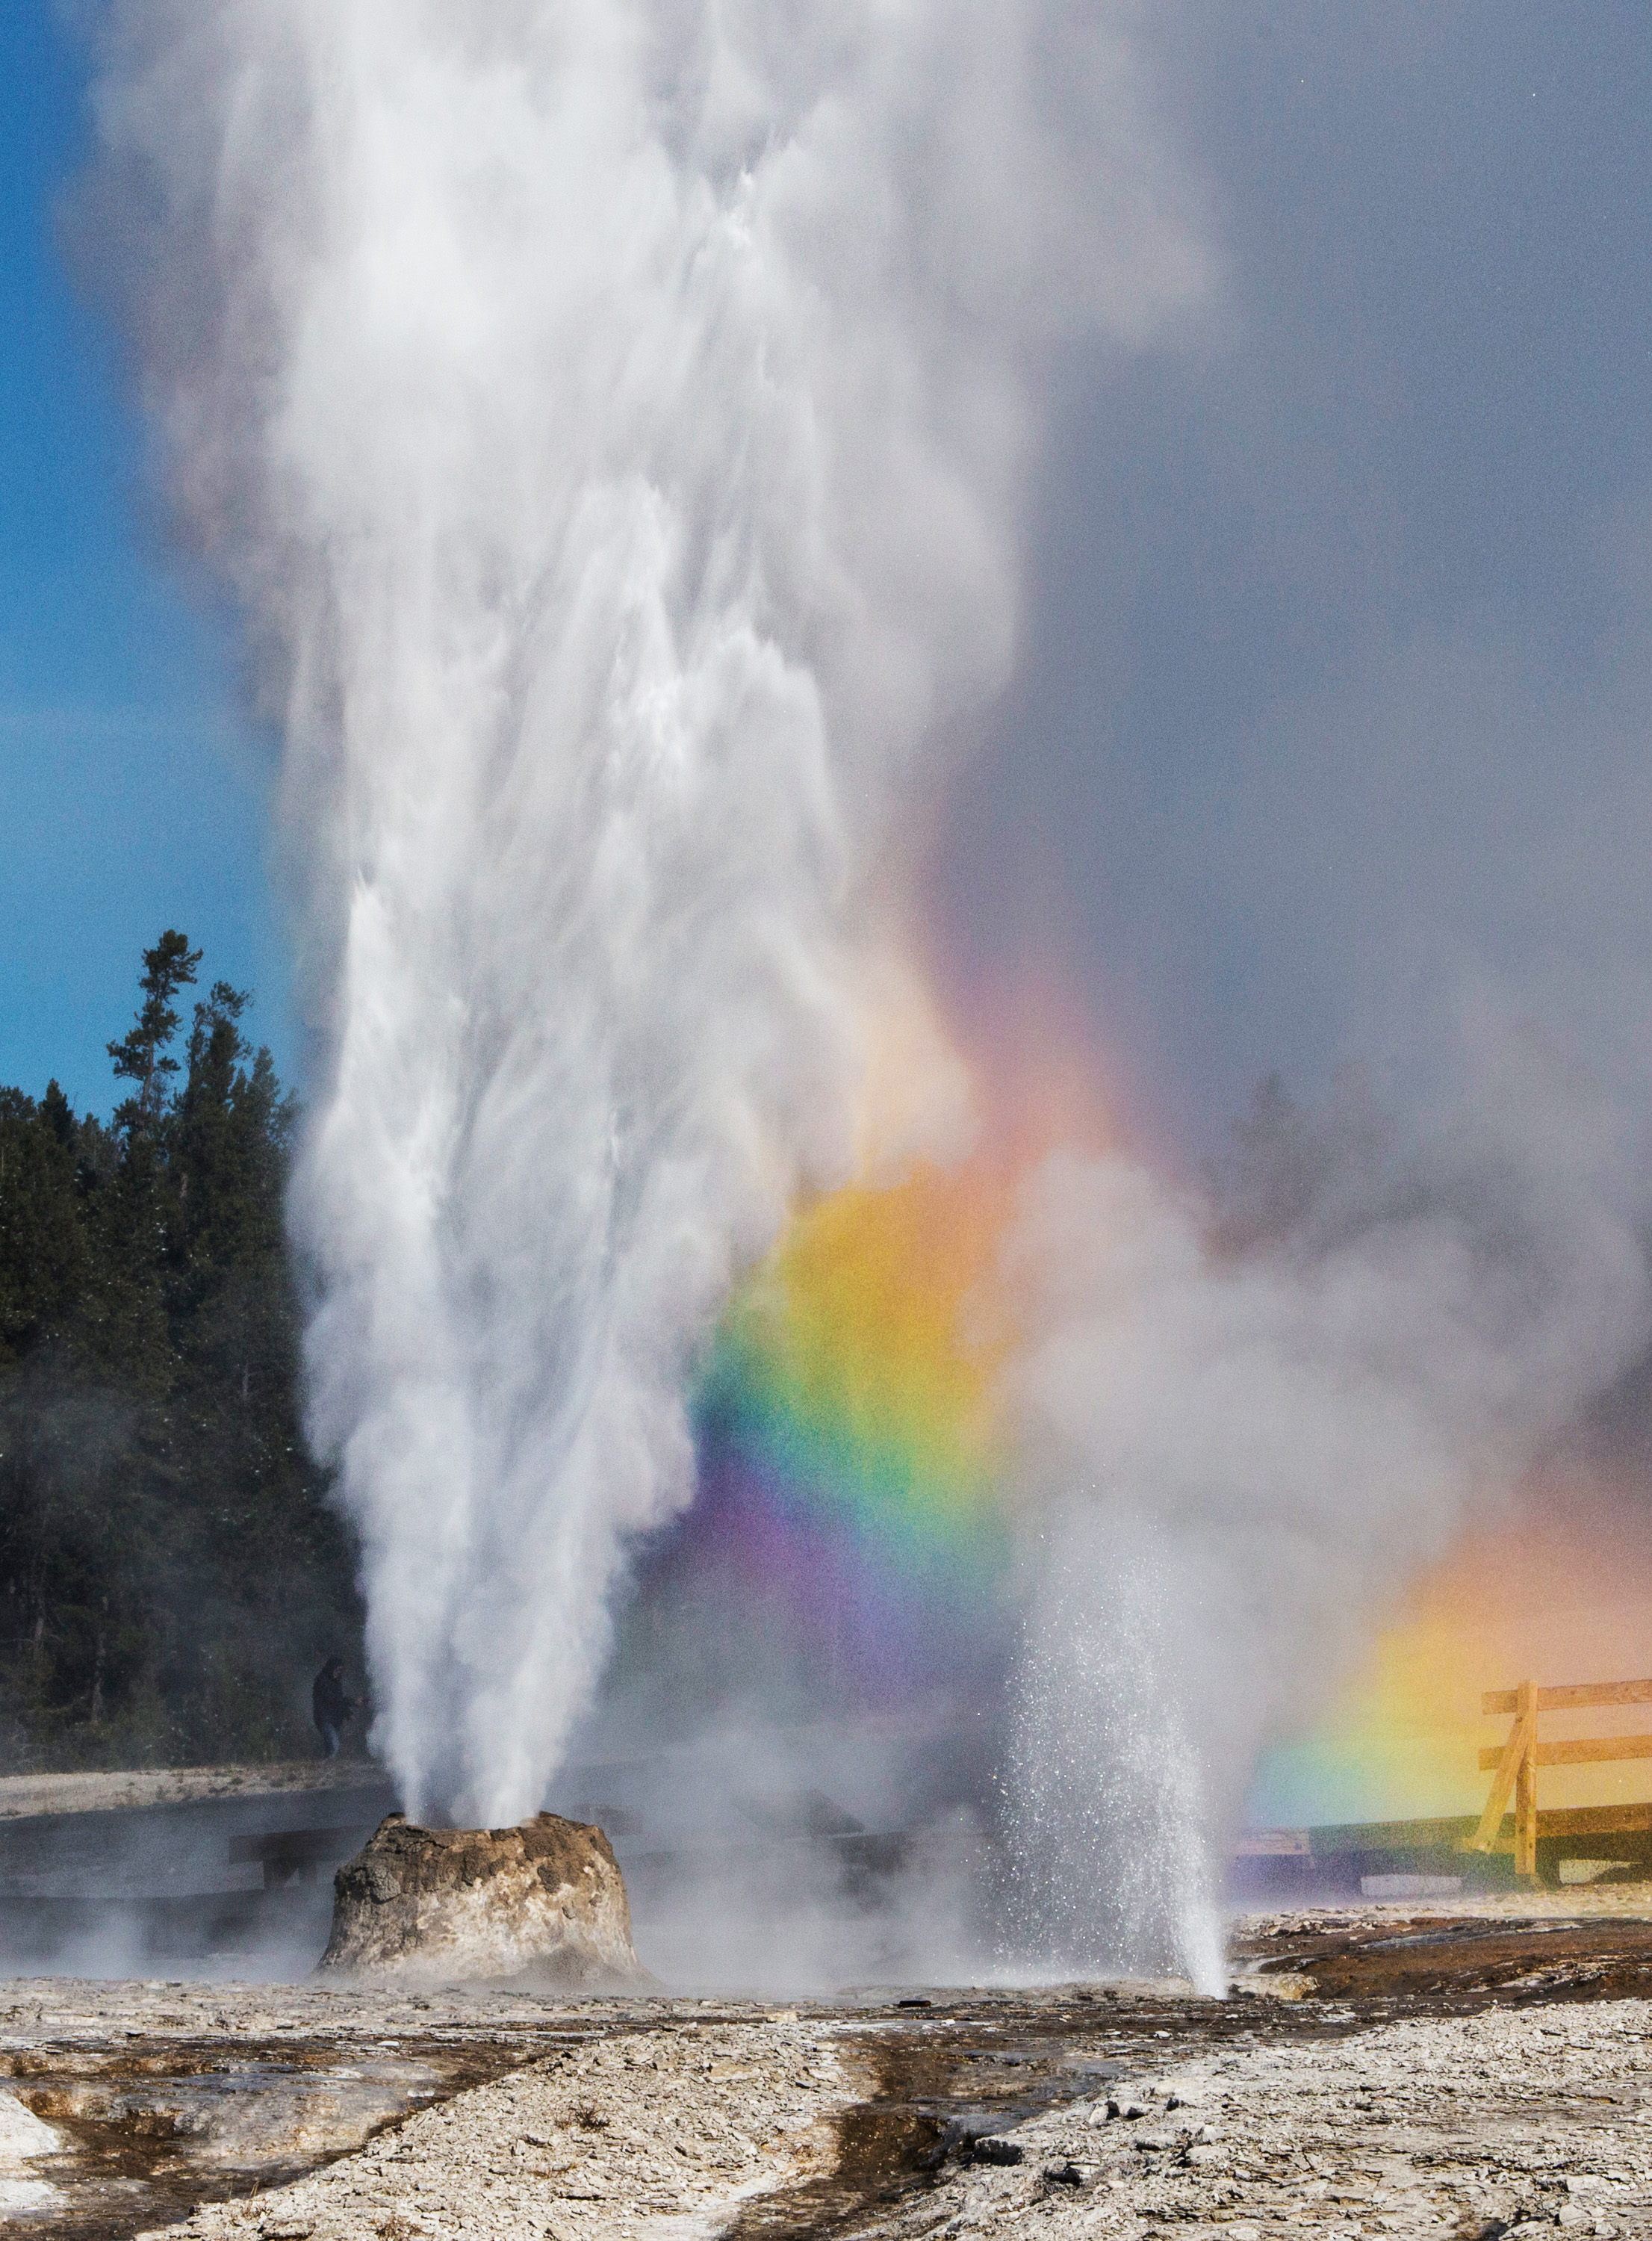
The Thermals Features of Yellowstone
Just over 3,000 words you didn't know you wanted to read.
Published on: Tuesday, 07 October 2025 at 11:55 UTC
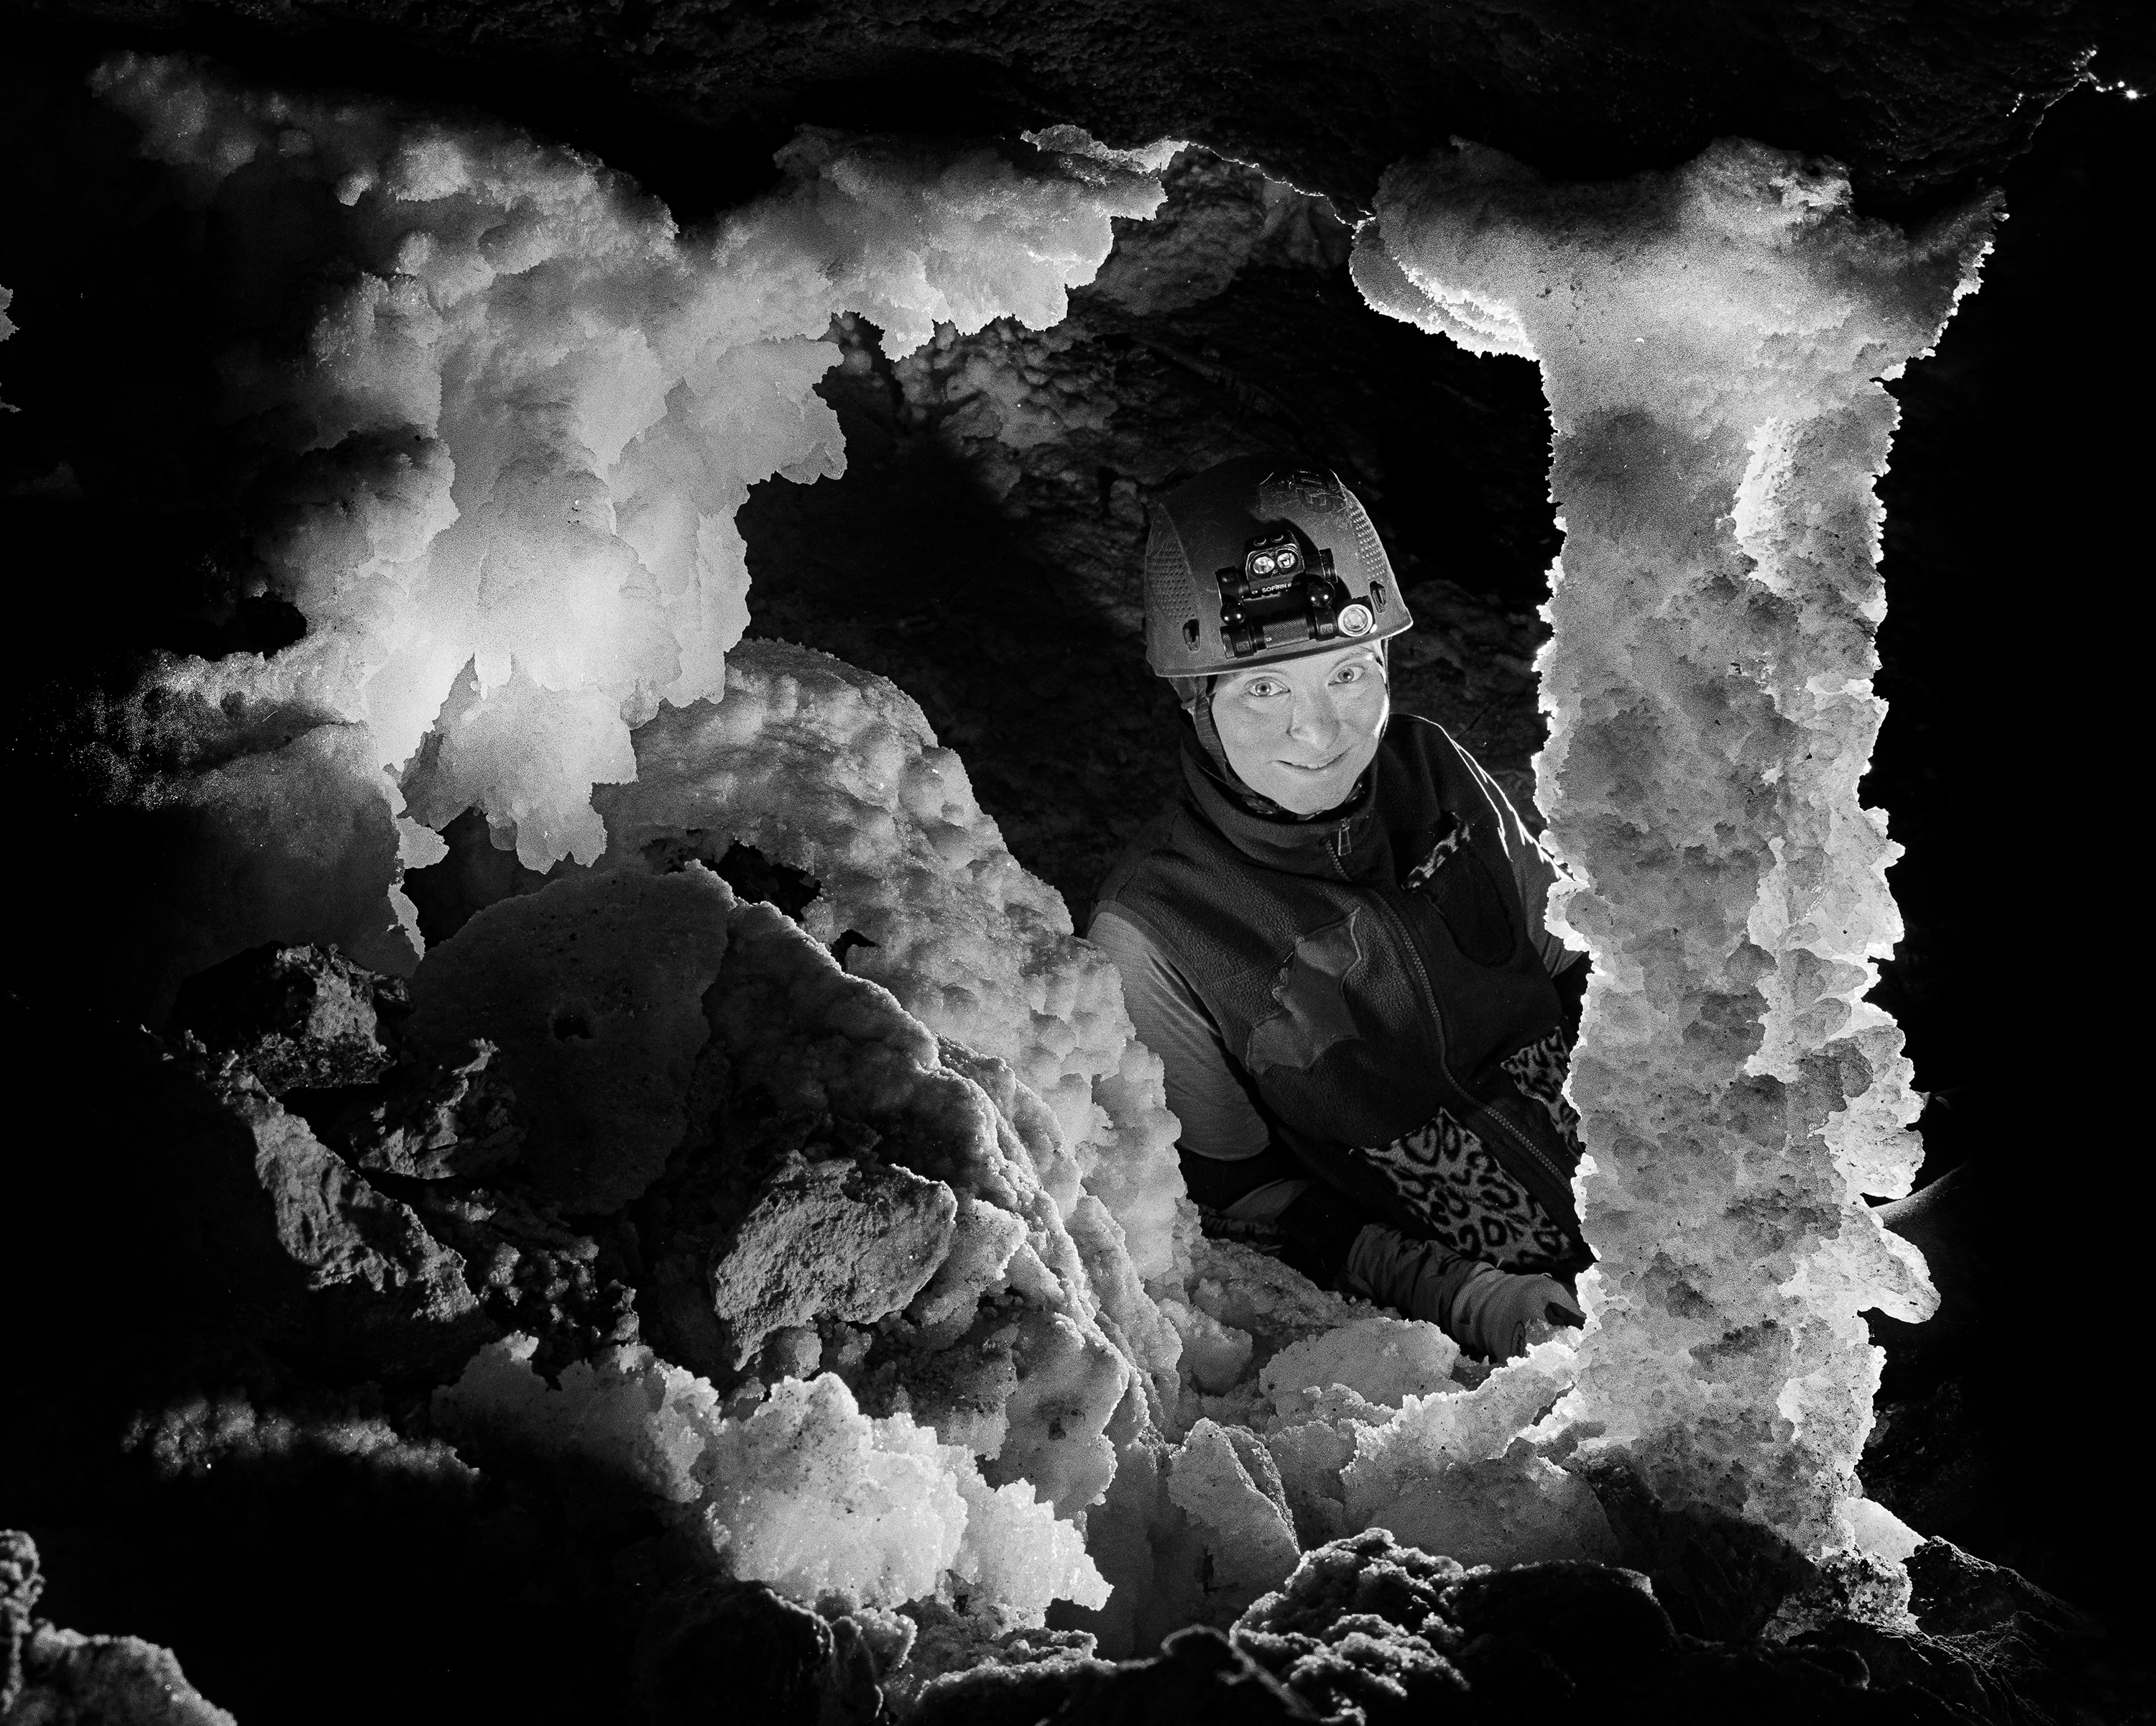
Trip Report: Bighorn-Horsethief Cave System
Surveying and photography during the August 2025 project weekend.
Published on: Wednesday, 01 October 2025 at 11:55 UTC
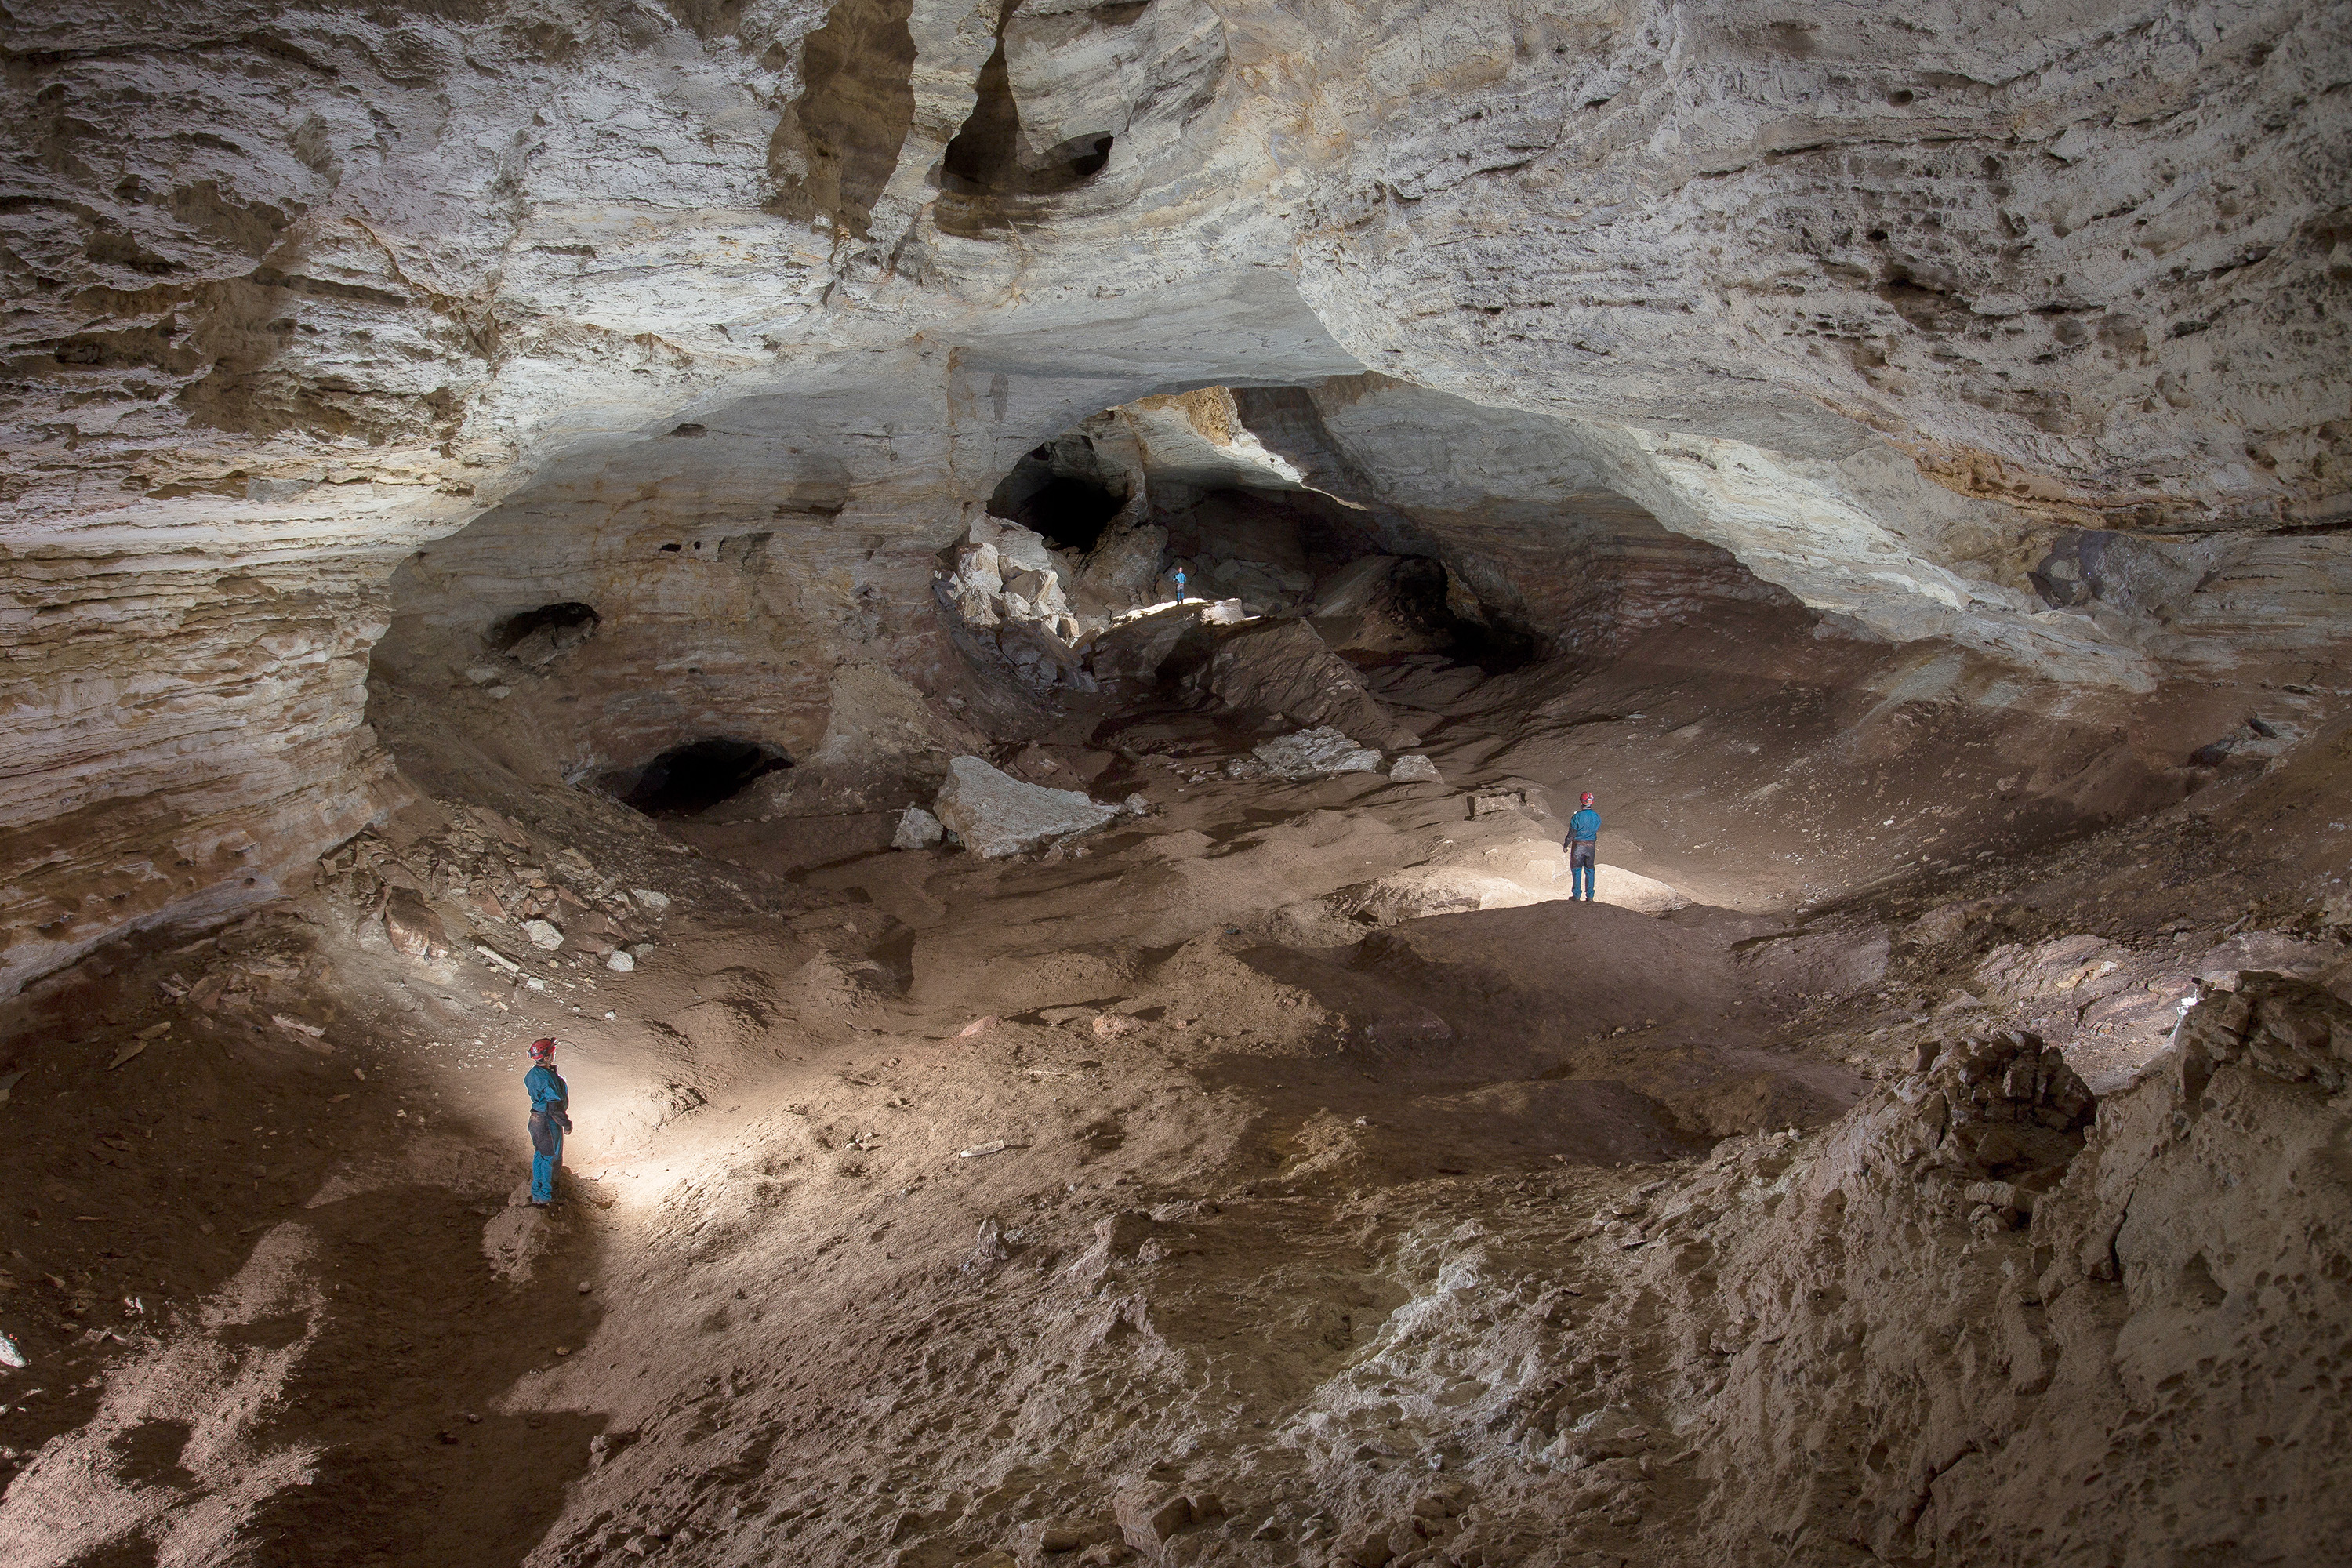
Bighorn-Horsethief Cave System
An introduction to the longest known cave in Wyoming and Montana
Published on: Tuesday, 23 September 2025 at 11:55 UTC
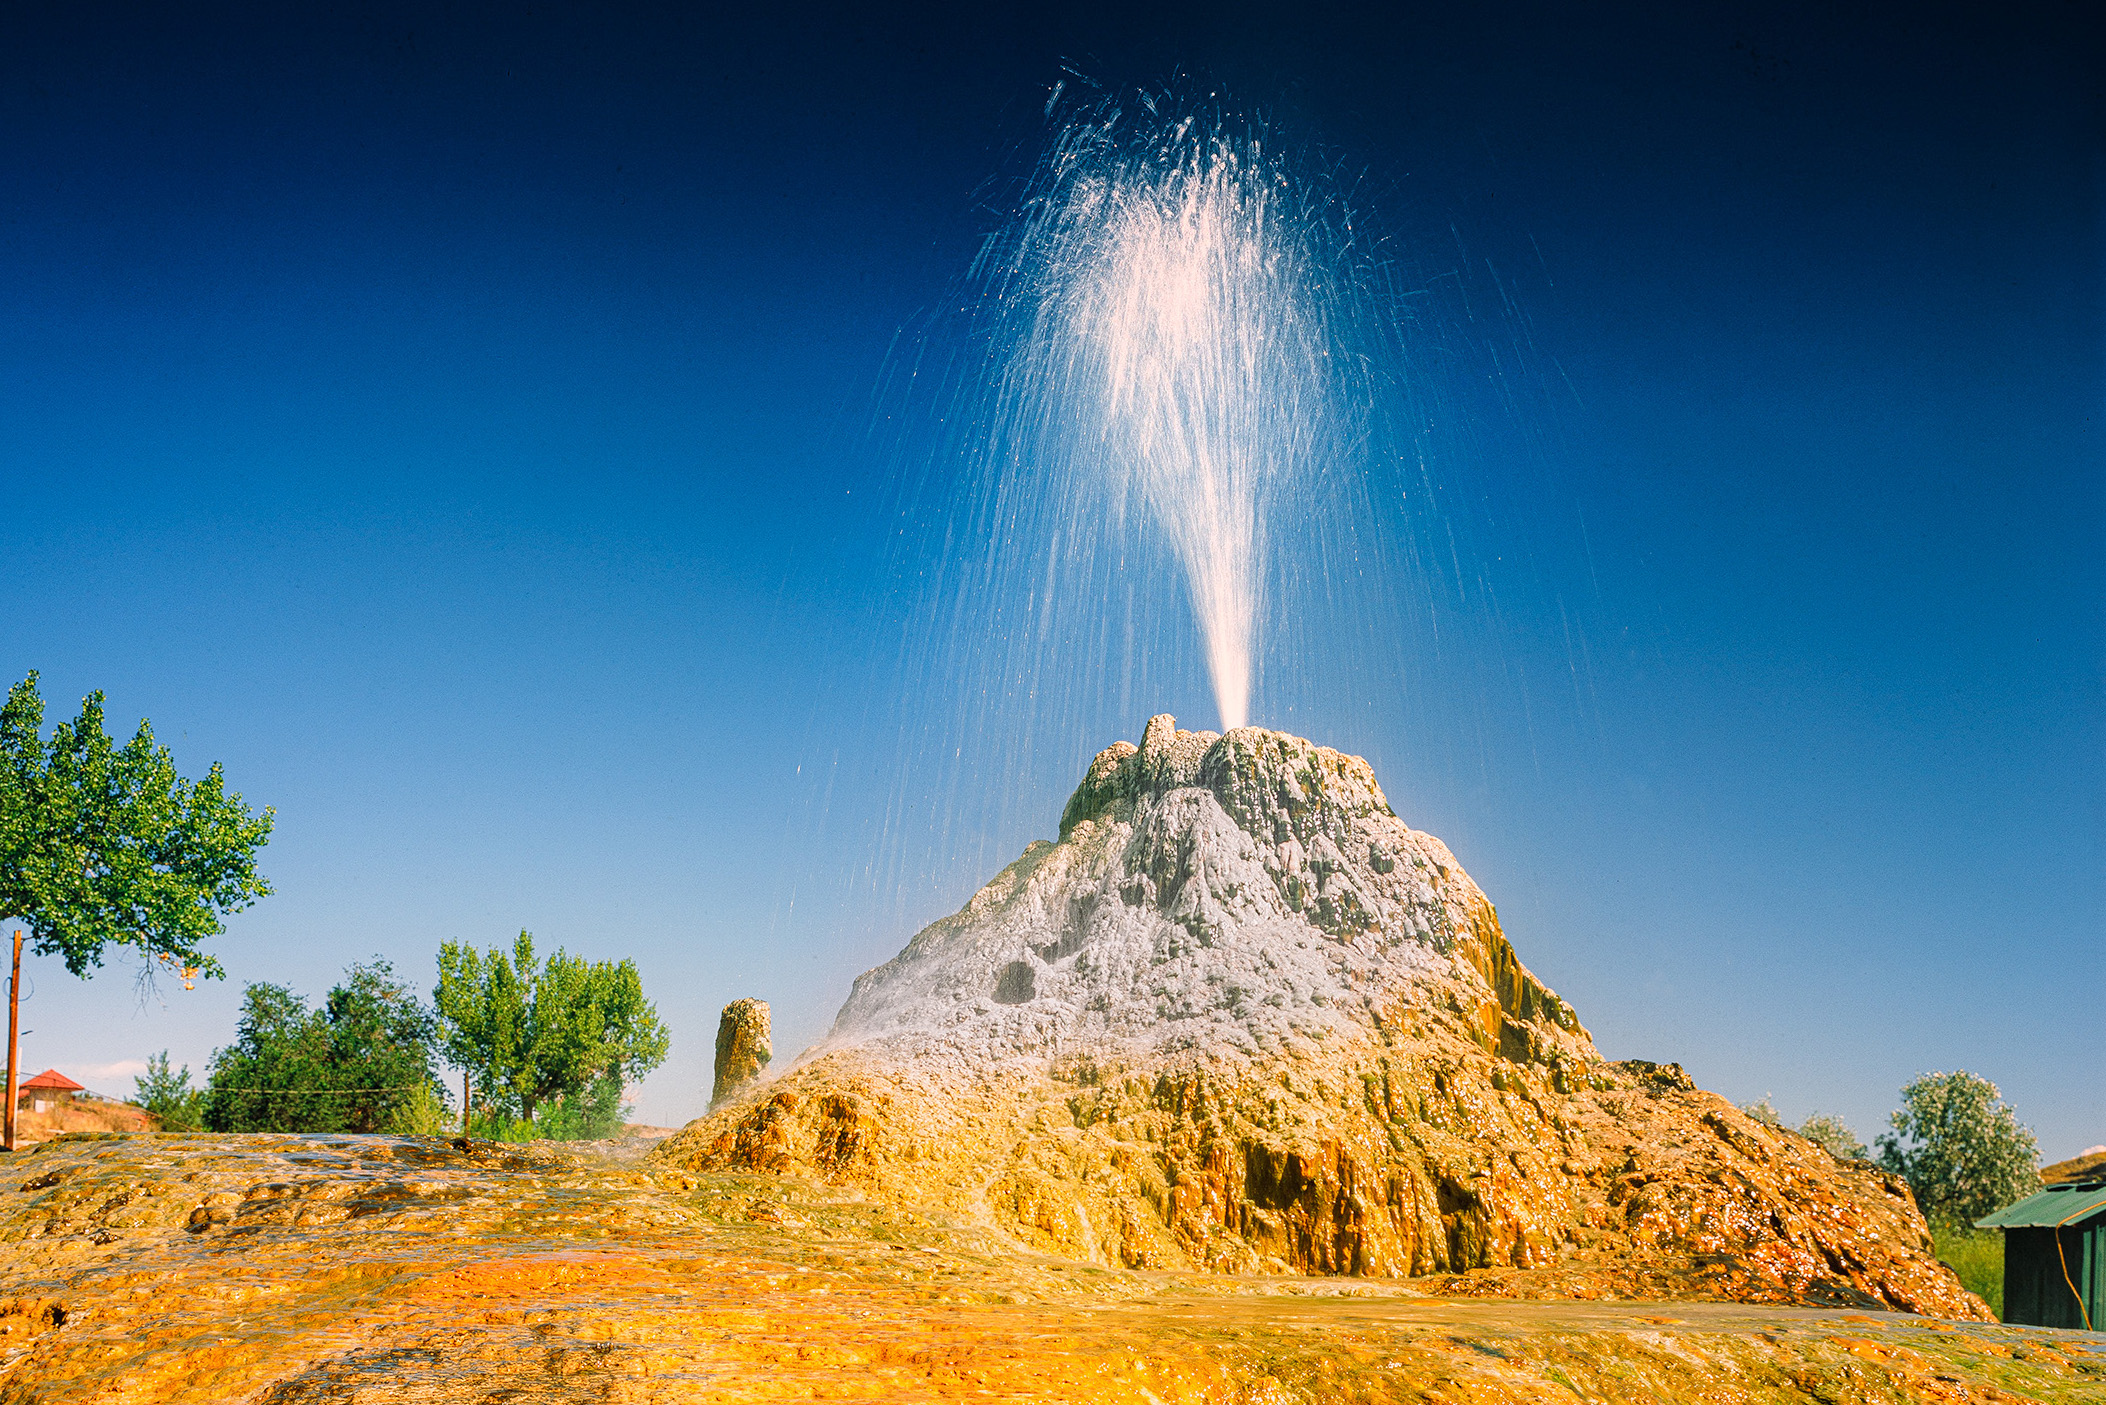
Thermopolis, WY, August 2025
Large travertine hot springs in central Wyoming
Published on: Friday, 19 September 2025 at 11:55 UTC
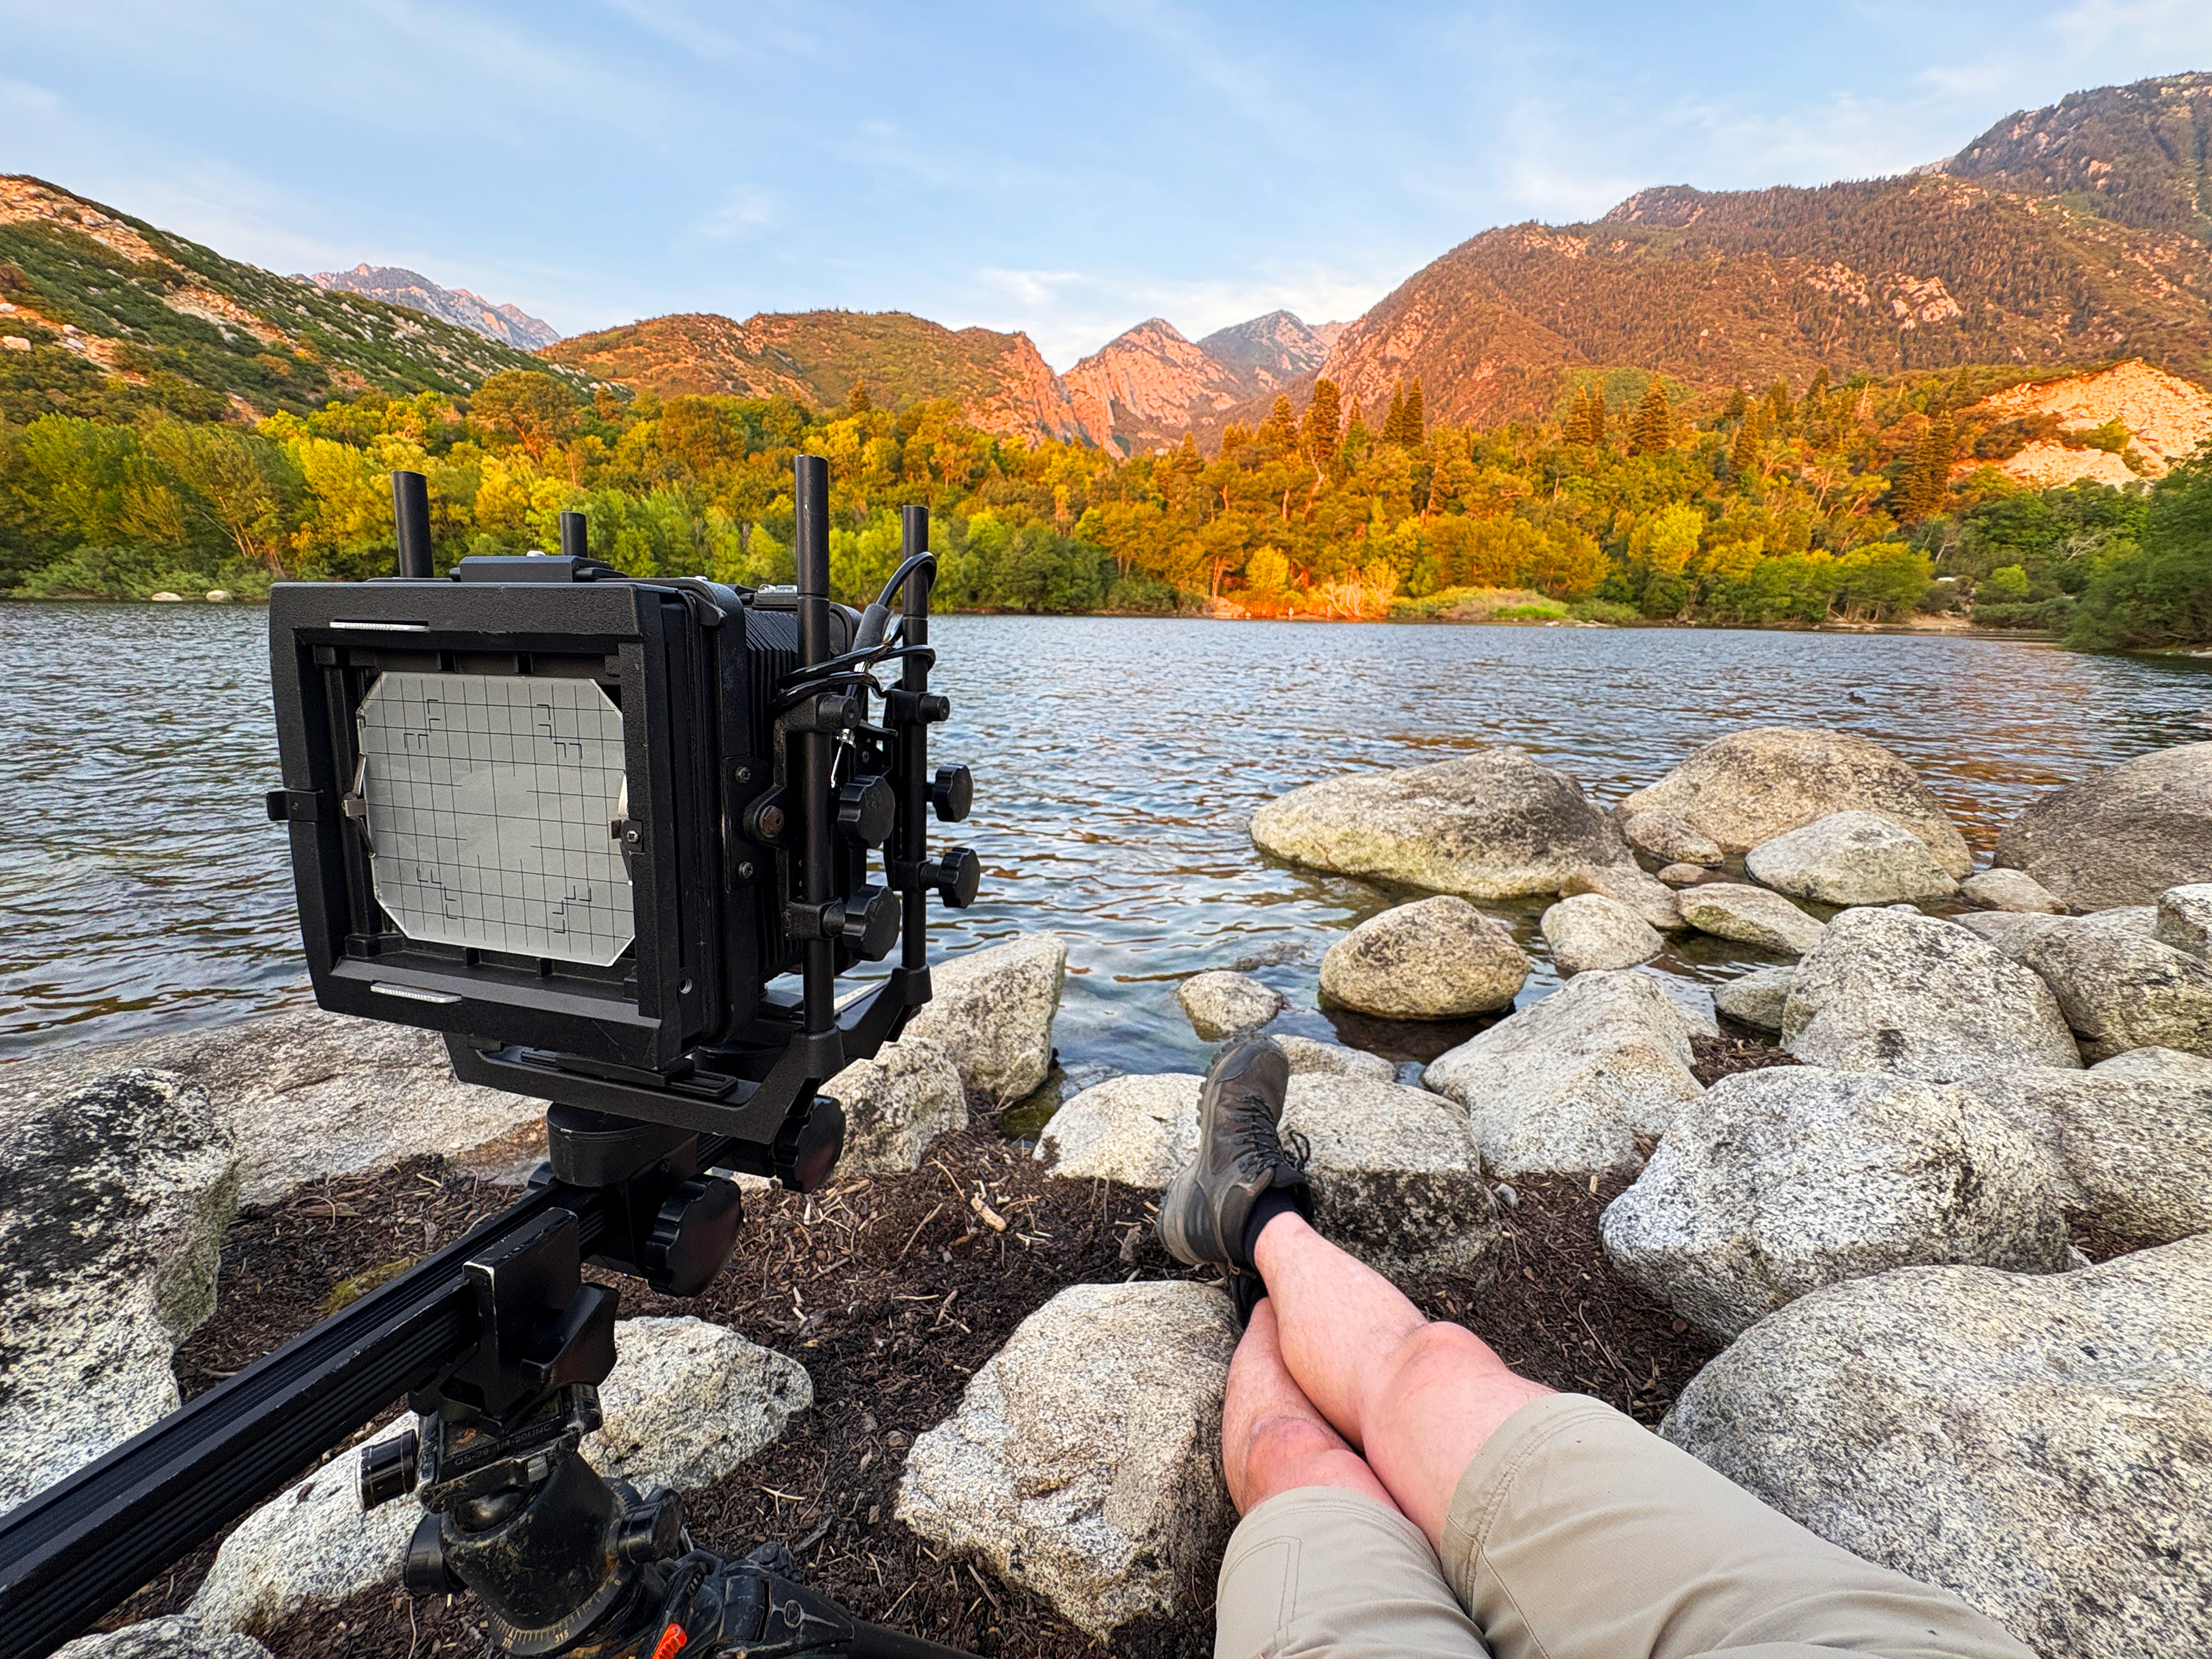
Lazy Photography in the Wasatch Range
Easy hiking and drive up sunsets from suburban Salt Lake City
Published on: Thursday, 11 September 2025 at 12:26 UTC
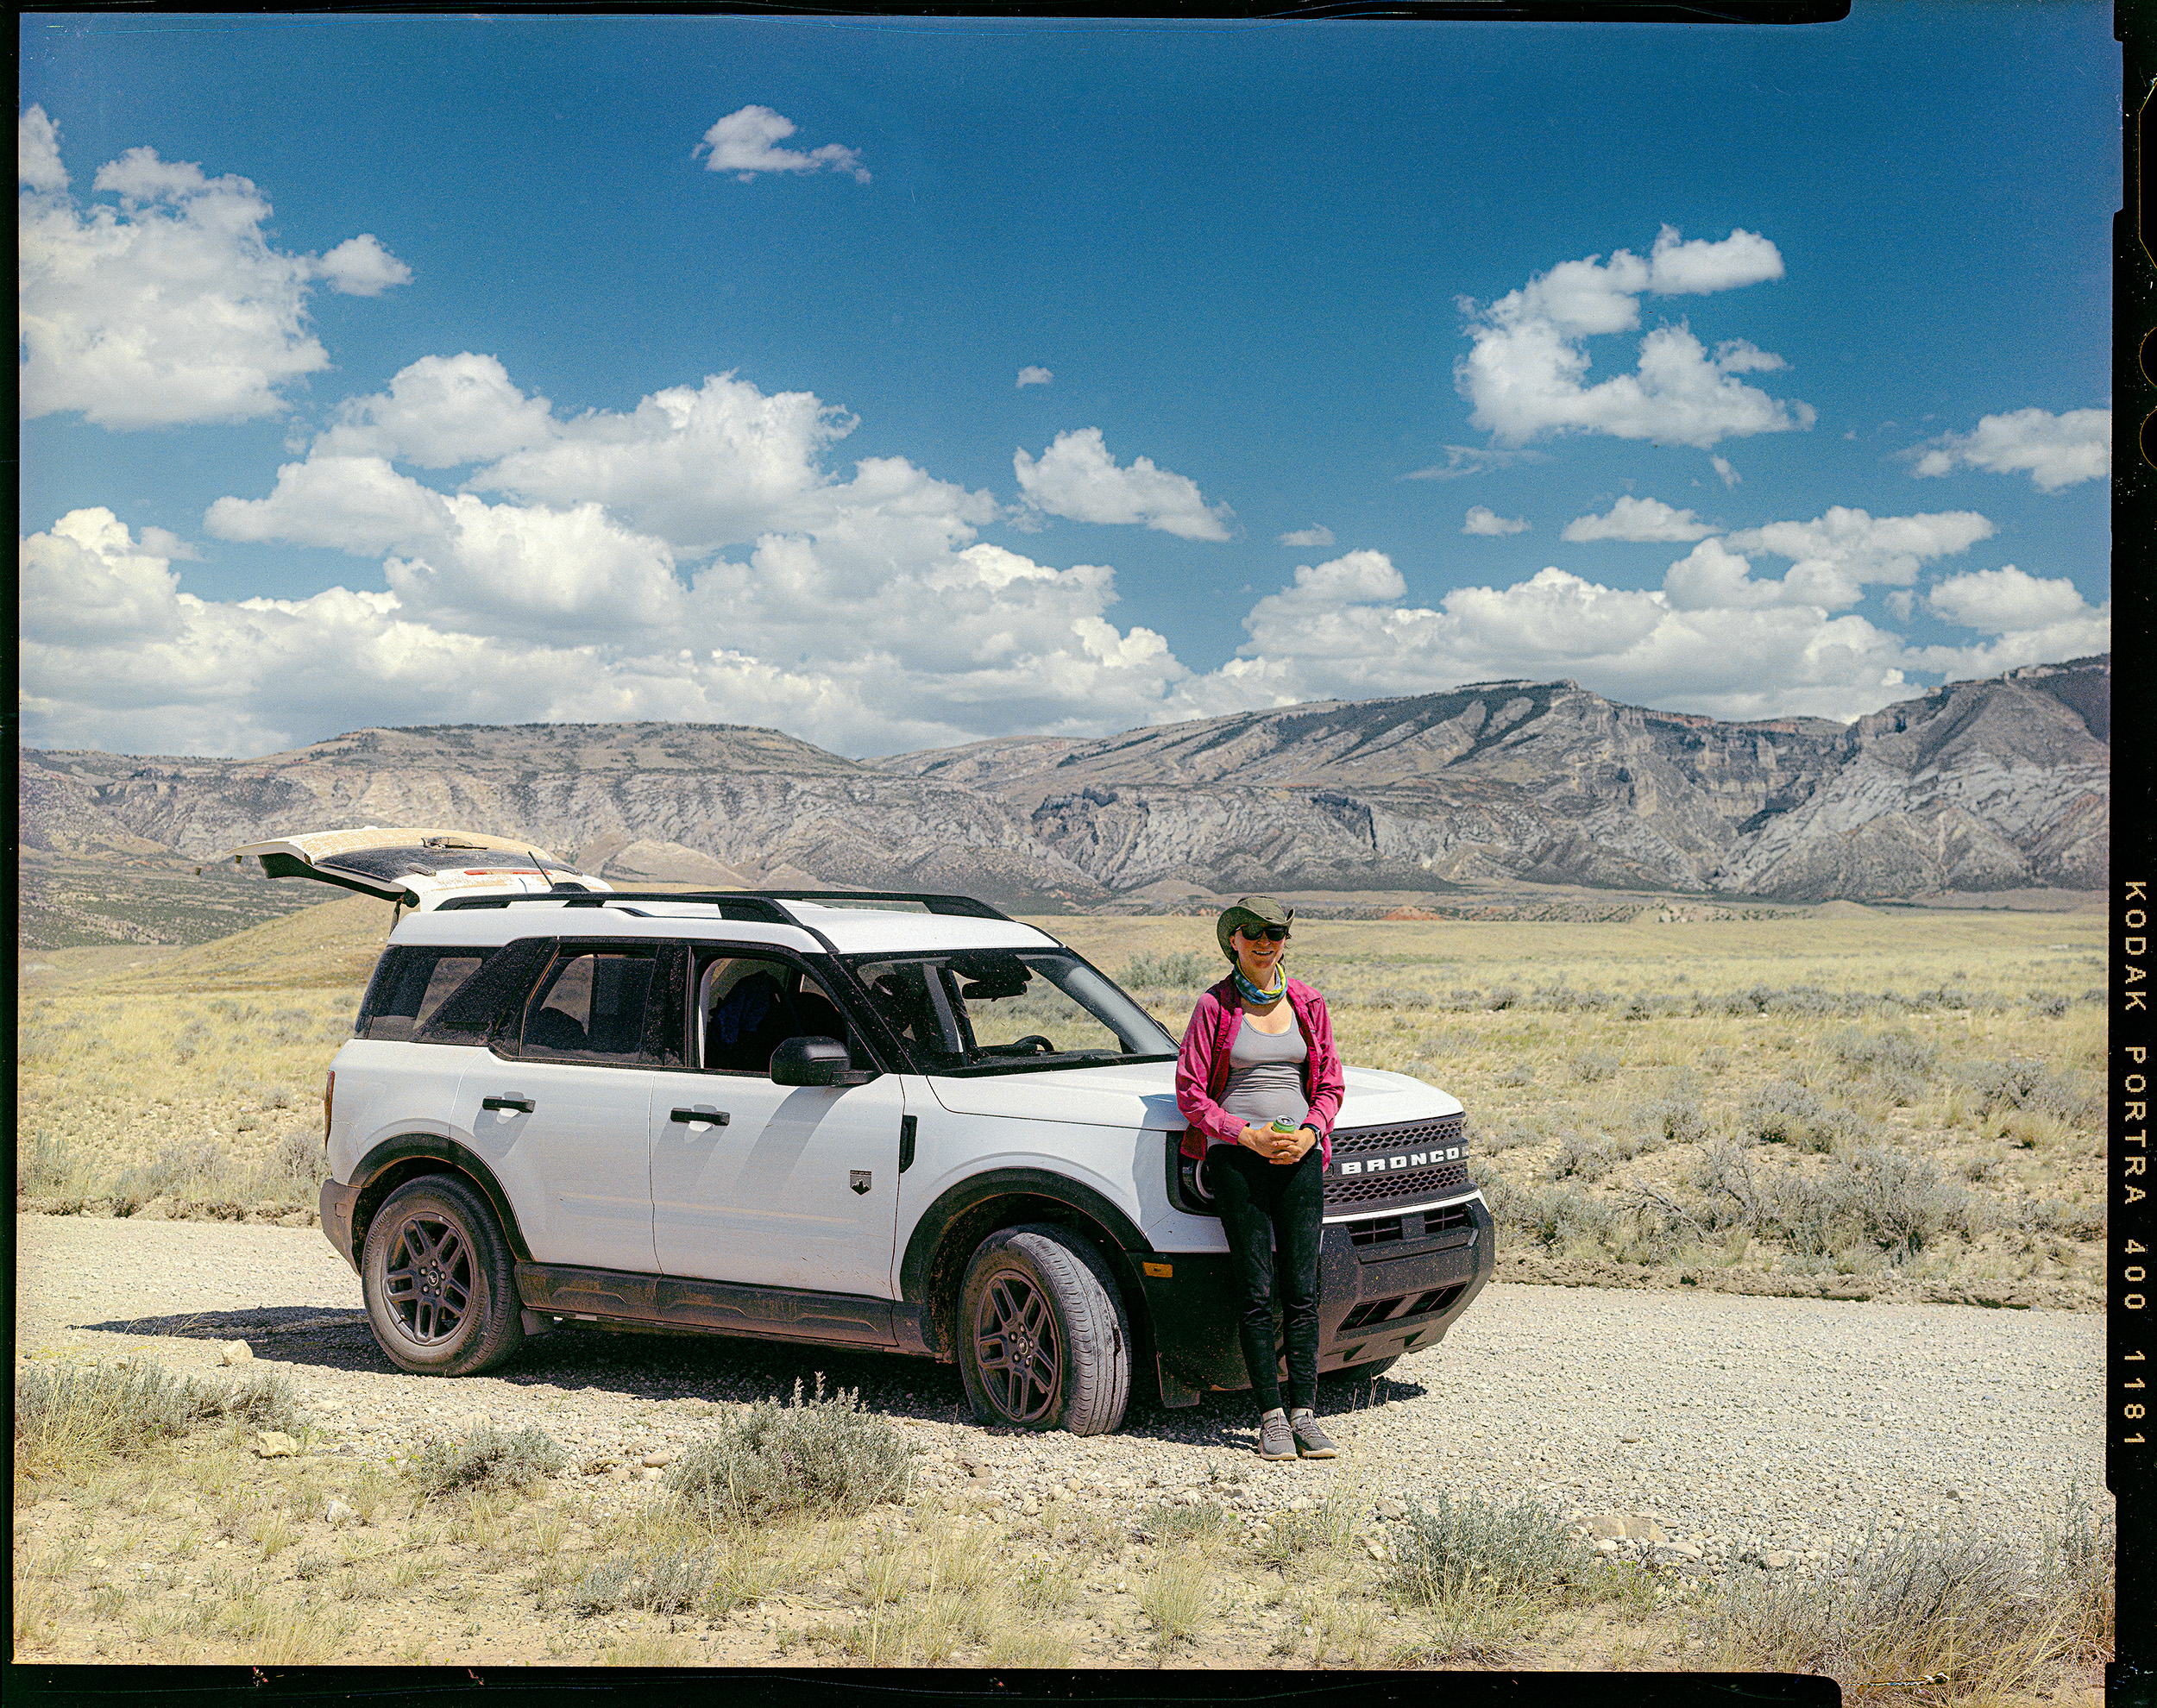
Car Review: 2026 Ford Bronco Sport
1500 miles of driving and camping with the 2026 Ford Bronco Sport
Published on: Wednesday, 10 September 2025 at 11:55 UTC
Wyoming, August 2025
Logistics and gear for eleven days of caving and photography in Big Sky Country
Published on: Wednesday, 10 September 2025 at 11:55 UTC
.jpg)
Tonto Natural Bridge
Massive travertine formation in central Arizona
Published on: Wednesday, 29 November 2023 at 11:55 UTC

Building This Website
Part 1: Lessons learned in mentally herding cats.
Published on: Friday, 14 July 2023 at 19:48 UTC
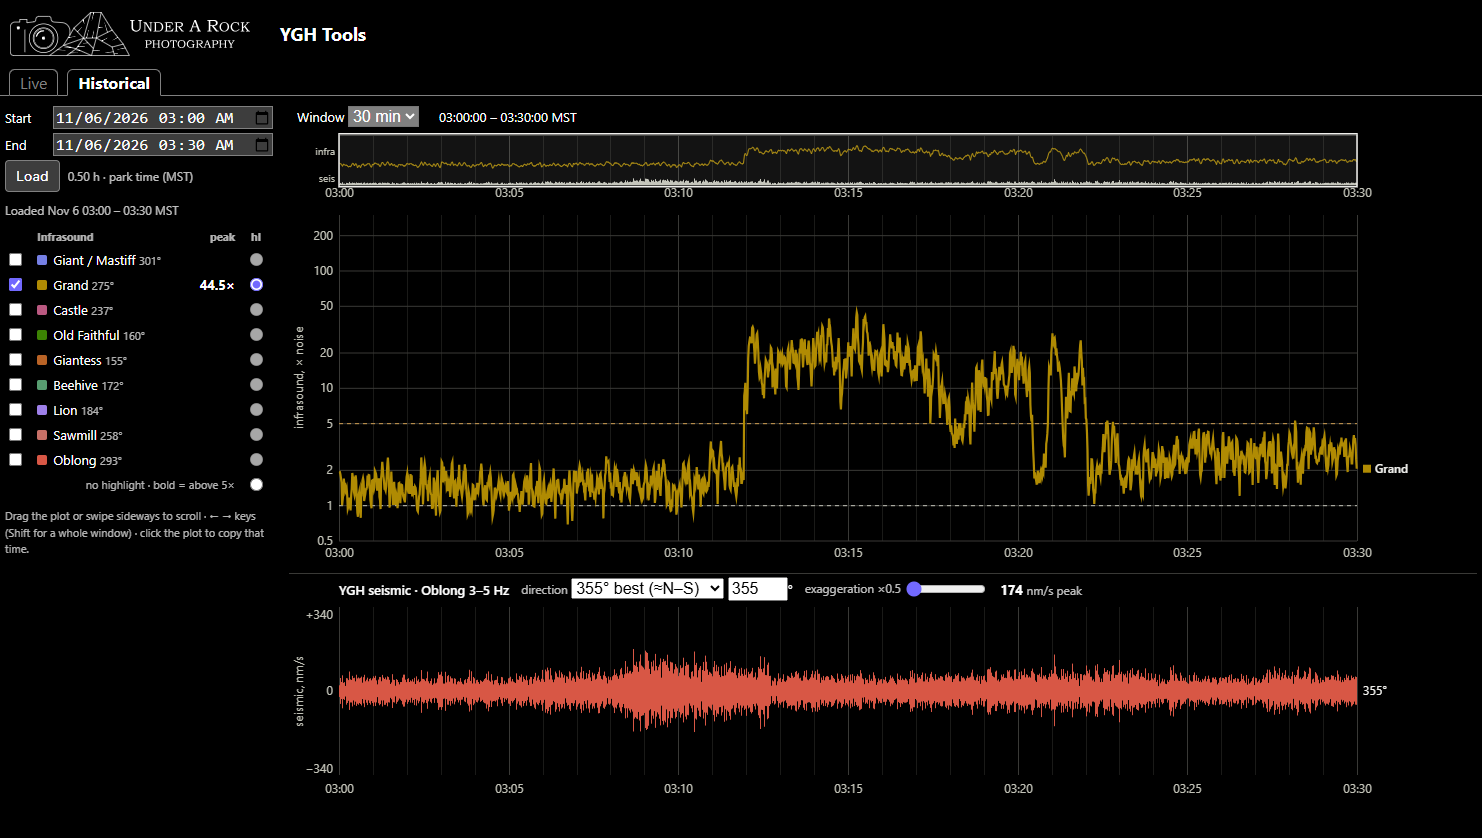
Infrasound and seismic traces for an eruption of Oblong at 0308 and a 2 burst eruption of Grand at 0311 on 6 November 2026.
YGH Monitor App - Pt. 2: How to Use the Tools
Instructions on how to navigate and use the YGH Monitor App for various forms of geyser gazing.
Published: Saturday, 07 November 2026 at 00:55 UTC
Contents:
Accessing the YGH Monitor
The YGH Monitor can be accessed from the Apps page or directly at YGH Monitor.
YGH Monitor Layout and Panels
The YGH Monitor has four main panels:
1. Header and App Version

The header includes my business logo, the app title, and then the version of the app you're currently seeing. The most current version is
V 2026.11.11b
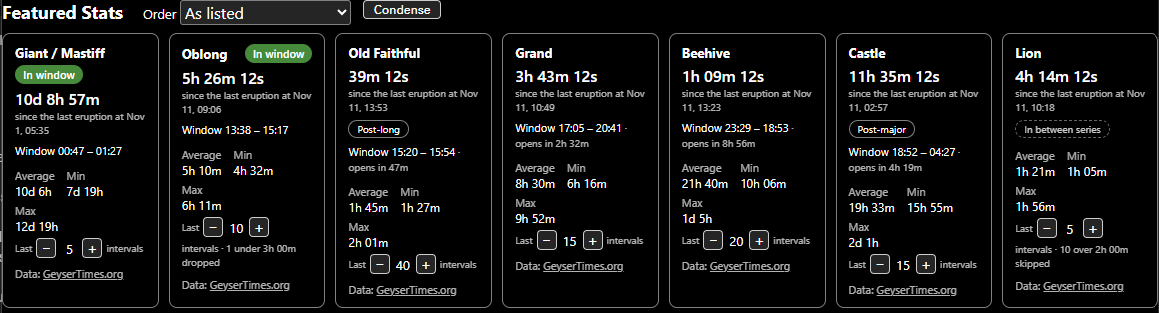
2. Featured Stats
The Feratured Stats panel pulls in data from GeyserTimes to show when the last reported eruptions were for each of the geysers shown on the monitor. You can condense these panels using the CONDENSE button and sort their display order using the dropdown.
3. Image Exporter and Theme Setters
The buttons here allow you to export the current view as an image to save or copy and set the color theme.

- IMAGE: exports the current panel as an image.
- CLIP: Grab the current panel and copy it as an image to your clipboard.
- SAVE: Grab the current panel and save it as a PNG to your device.
- THEME:
- Light: light mode – lots of bright colors
- Dark: dark mode – lots of dark colors.
- LIVE: This tab opens the live monitor.
- ARCHIVE: This tab opens the explorer for the historical archive.
4. Live Monitor, Archive Viewer, Grand Checker Tabs
The bottom panel is whichever application is currently open to be used; either the Live Monitor, Archive Viewer, or Grand Checker. Each is noted below.
Live Monitor Controls
The Live Monitor allows viewing of the YGH data as it is available. The Infrasound Viewer and Seismic Viewer here are identical to the ones in the Archive and are described below. Only the Status and Timing Panels are unique to the Live Monitor as the former tells you when the most recent data was pulled and the latter controls how often and how much data is shown.
The Status Panel
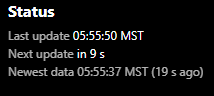
This panel shows the time of the last attempted data update, a countdown to the next update, and the time of the most recent data and it’s age in seconds.
The Timing Panel
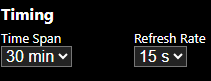
This lets you set the time span of the windows and the refresh rate for the data.
Archive Viewer Controls
Go to the Archive Tab to open the archive explorer.
Find An Eruption
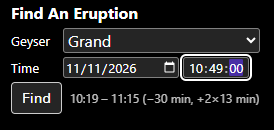
This panel lets you get data for an eruption of a known feature and known time. Click "Find" after you have specified a feature and a date/time. The data fetched will automatically be from 30 minutes before the eruption time to 2 times the usual duration of that feature. The data gets autopopulated into the Get Data From panel which is desacribed below.
Get Data From
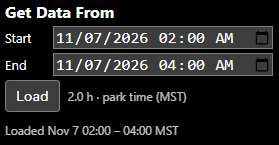
This panel lets you choose the time span to grab data from. A maximum of 6 hours is allowed due to file sizes. Click “Load” to pull in the data from EarthScope.
Infrasound Viewer
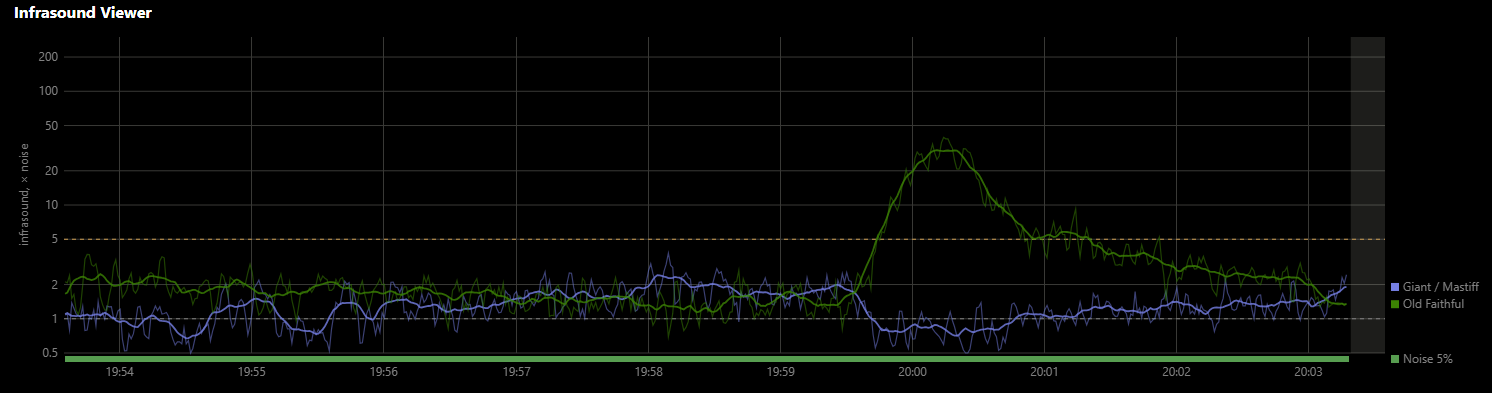
This panel displays the infrasound data. The x-axis is time in HH:MM, and y-axis is relative level of noise. A color key is on the right side for each feature. Each feature has it's real time data plotted (that's the bouncing line) and a smoothed average (the bolder line). Below the plot above the time is a color strip indicating ambient noise hitting the sensor array. Green means the ambient conditions are quiet, yellow means they are loud and may distort signals, and red means the sensors are being saturated with ambient noise.
Infrasound Targets
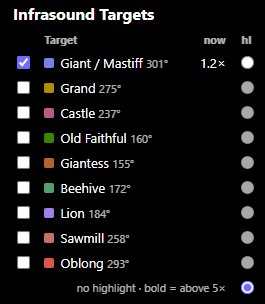
These are the currently available directions to ‘aim’ the sensor at. By checking the features you will see their data traces come up on the Infrasound Viewer. When turned on you’ll also see a “now” value which is the relative loudness of that bearing, and an option to select the data to highlight it. Selecting the 'hl' button will make that data trace get brighter in the Infrasound Viewer.
Seismic Viewer
This panel shows the seismic data arriving at the YGH Seismometer. The viewer can show multiple waveforms stacked on top of each other or overlaid. The exaggeration slider changes the amplification of the signal.

Seismic traces for both Oblong Geyser and Doublet Pool in overlay mode. The red waveforms show the horizontal waves arriving in the 3-5Hz range - usually where Oblong readily shows up. The green waveforms show the slightly higher frequency waves in the vertical direction - which tend to arrive from Doublet Pool.
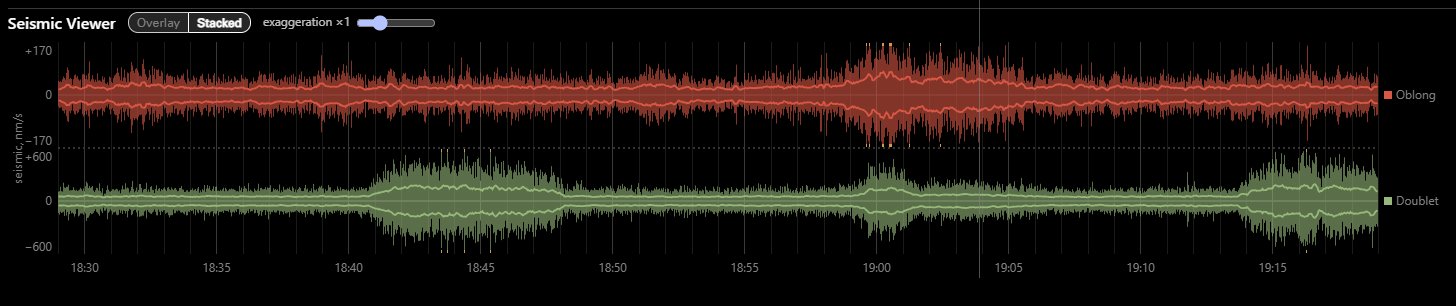
Seismic traces for both Oblong Geyser and Doublet Pool in stacked mode. The red waveforms show the horizontal waves arriving in the 3-5Hz range - usually where Oblong readily shows up. The green waveforms show the slightly higher frequency waves in the vertical direction - which tend to arrive from Doublet Pool. You'll notice there is a vertical component arriving from Oblong as well.
Seismic Traces
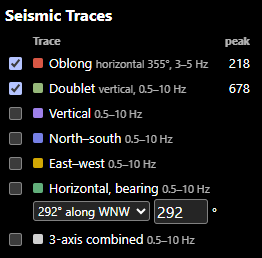
These are the currently available traces from the YGH seismometer. They each have their own frequency bands and orientations:
- Oblong: Filtered for horizontal waves which move roughly north-south at frequencies of 3-5Hz
- Doublet: Filtered for the slightly higher frequency and mostly vertical waves coming from Doublet Pool
- Vertical: All vertical waves in the 0.5-10Hz range.
- North-south: All horizontal waves moving north to south in the 0.5-10Hz range.
- East-west: All horizontal waves moving east to west in the 0.5-10Hz range.
- Horizontal, bearing: All horizontal waves moving along a user specified bearing.
- 3-axis combined: All seismic waves in the 0.5-10Hz range in all three axis of motion combined.
Archive Viewer Tools
Overview Window

The overview window shows a summary of the data returned for the specified time range. The highlighted rectangualr box on the data shows the window of time currently shown in the Infrasound Viewer. The window can be clicked and dragged to move through data, clicking anywhere will move the window to that point. The size of the window can be changed using the window dropdown selector.
Creating Time Stamps and Measuring Durations
The Archive Viewer has the capability to create timestamps to read the data at that specific time.
You can get data at any point by right-clicking on the plot. This is only a temporary time stamp. Clicking anywhere else will erase this time stamp.
You can get data at any point by right-clicking on the plot. This is only a temporary time stamp. Clicking anywhere else will erase this time stamp.
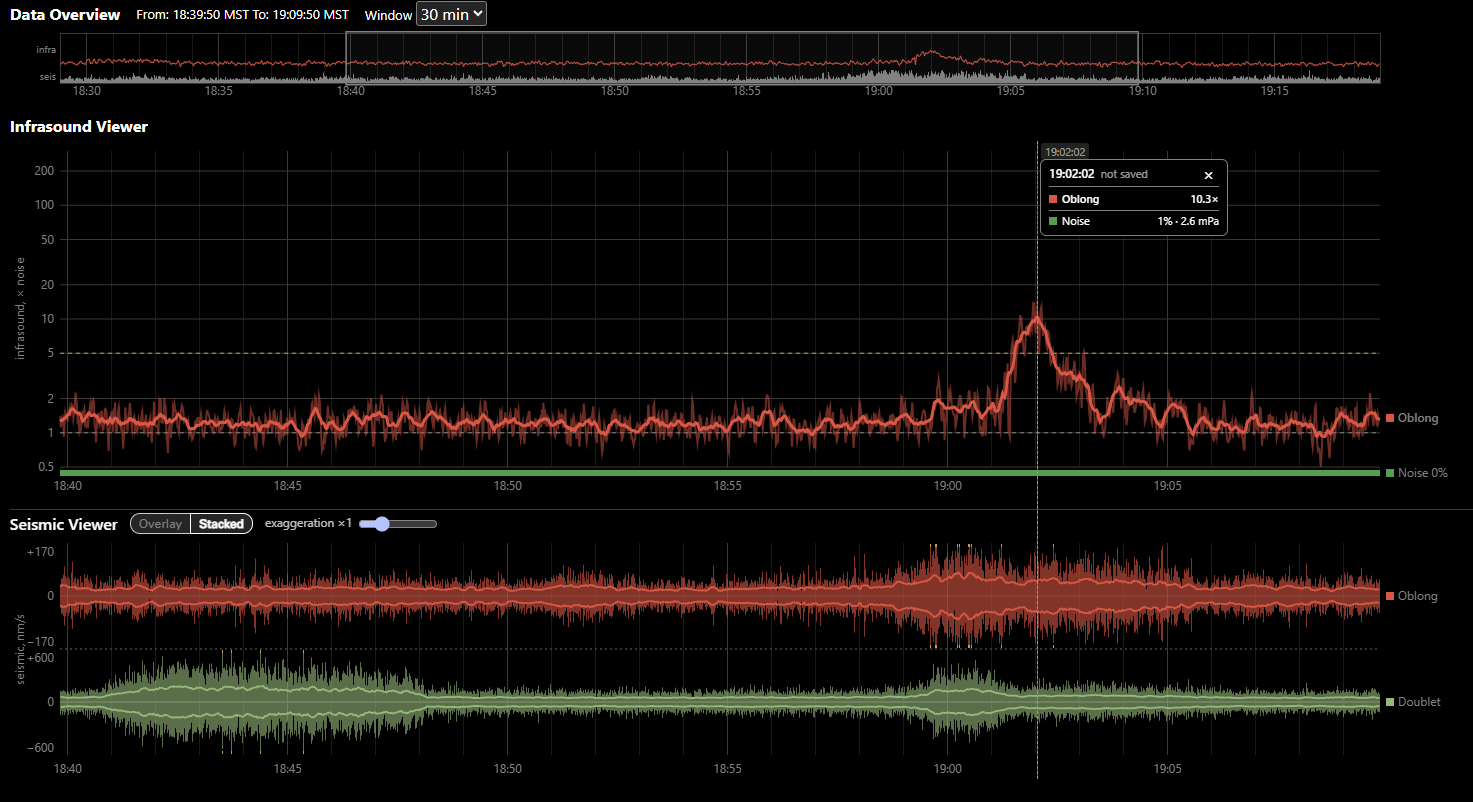
Here is a temporary timestamp at 19:02 during the peak of infrasound from Oblong. It shows that Oblong was currently at 10x the normal noise in that direction and that ambient background noise was very low at under 5%.
You can set permanent time stamps by left clicking on the plot. You can set as many of these as you'd like.
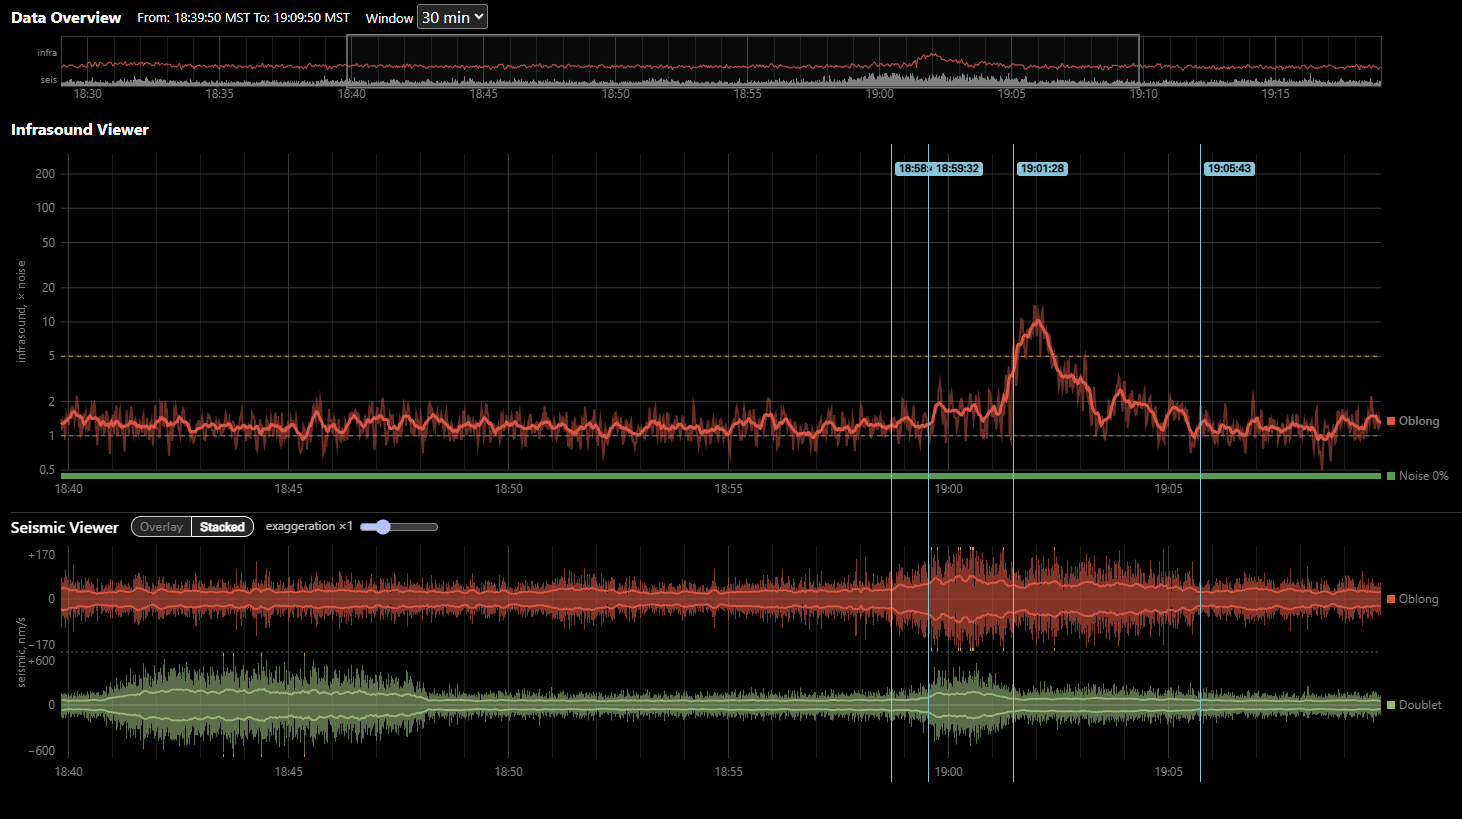
Left clicking will set a permanent time stamp.
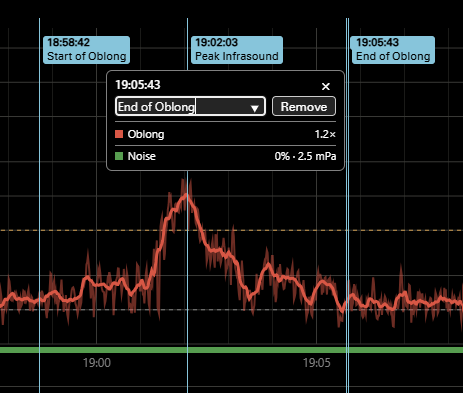
Right-clickingon the stamp will show the data details, allow you to set a name for it, and remove it.
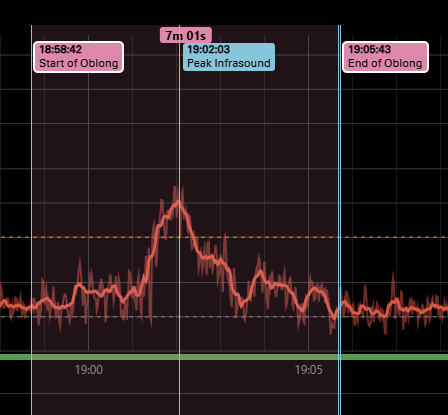
By clicking on any two timestamps you can calculate the duration between them.
Grand Checker (beta)
The Grand Checker is a tool for analyzing the infrasound data coming from Grand Geyser to help determine if one or more bursts occurred. It is currently in a beta phase and is explained in the Use Cases Blog post.

 v.2026.11.12.A
%20--%3e%3cdefs%3e%3cstyle%3e%20.st0%20{%20fill:%20%23fff;%20}%20%3c/style%3e%3c/defs%3e%3cg%3e%3cpath%20class='st0'%20d='M55.7,107.69h-11.41l-2.1,5.82h-3.6l9.46-26.01h3.94l9.42,26.01h-3.6l-2.1-5.82ZM54.73,104.91l-4.73-13.21-4.73,13.21h9.46Z'/%3e%3cpath%20class='st0'%20d='M80.79,100.43c-1.49,1.44-3.76,2.16-6.81,2.16h-5.03v10.92h-3.42v-26.16h8.45c2.95,0,5.2.71,6.74,2.14,1.54,1.43,2.31,3.27,2.31,5.52s-.74,3.98-2.23,5.42ZM78.19,98.53c.9-.83,1.35-2,1.35-3.53,0-3.23-1.85-4.84-5.56-4.84h-5.03v9.61h5.03c1.9,0,3.3-.41,4.2-1.24Z'/%3e%3cpath%20class='st0'%20d='M102.53,100.43c-1.49,1.44-3.76,2.16-6.81,2.16h-5.03v10.92h-3.42v-26.16h8.45c2.95,0,5.2.71,6.74,2.14,1.54,1.43,2.31,3.27,2.31,5.52s-.74,3.98-2.23,5.42ZM99.92,98.53c.9-.83,1.35-2,1.35-3.53,0-3.23-1.85-4.84-5.56-4.84h-5.03v9.61h5.03c1.9,0,3.3-.41,4.2-1.24Z'/%3e%3cpath%20class='st0'%20d='M112.66,112.85c-1.36-.61-2.43-1.46-3.21-2.55-.78-1.09-1.18-2.35-1.2-3.77h3.64c.13,1.23.63,2.26,1.52,3.1.89.84,2.18,1.26,3.88,1.26s2.91-.41,3.85-1.22c.94-.81,1.41-1.86,1.41-3.13,0-1-.28-1.81-.83-2.44s-1.24-1.1-2.06-1.43c-.83-.32-1.94-.68-3.34-1.05-1.73-.45-3.11-.9-4.15-1.35s-1.93-1.16-2.66-2.12c-.74-.96-1.11-2.26-1.11-3.88,0-1.43.36-2.69,1.09-3.79.72-1.1,1.75-1.95,3.06-2.55,1.31-.6,2.82-.9,4.52-.9,2.45,0,4.46.61,6.02,1.84,1.56,1.23,2.45,2.85,2.65,4.88h-3.75c-.13-1-.65-1.88-1.58-2.65-.93-.76-2.15-1.14-3.68-1.14-1.43,0-2.59.37-3.49,1.11s-1.35,1.77-1.35,3.1c0,.95.27,1.73.81,2.33.54.6,1.2,1.06,1.99,1.37.79.31,1.9.67,3.32,1.07,1.73.48,3.12.94,4.17,1.41,1.05.46,1.95,1.18,2.7,2.14s1.13,2.27,1.13,3.92c0,1.28-.34,2.48-1.01,3.6-.68,1.13-1.68,2.04-3,2.74-1.33.7-2.89,1.05-4.69,1.05s-3.27-.31-4.64-.92Z'/%3e%3c/g%3e%3cpath%20class='st0'%20d='M115.19,16.11C105.67.35,85.18-4.71,69.42,4.8c-15.76,9.52-20.82,30.01-11.31,45.77s30.01,20.82,45.77,11.31c15.76-9.52,20.82-30.01,11.31-45.77ZM81.9,49.87c0,1.65-1.34,2.98-2.98,2.98h-8.89c-1.65,0-2.98-1.34-2.98-2.98v-8.89c0-1.65,1.34-2.98,2.98-2.98h8.89c1.65,0,2.98,1.34,2.98,2.98v8.89ZM81.9,24.92c0,1.65-1.34,2.98-2.98,2.98h-8.89c-1.65,0-2.98-1.34-2.98-2.98v-8.89c0-1.65,1.34-2.98,2.98-2.98h8.89c1.65,0,2.98,1.34,2.98,2.98v8.89ZM107.24,49.87c0,1.65-1.34,2.98-2.98,2.98h-8.89c-1.65,0-2.98-1.34-2.98-2.98v-8.89c0-1.65,1.34-2.98,2.98-2.98h8.89c1.65,0,2.98,1.34,2.98,2.98v8.89ZM107.24,24.92c0,1.65-1.34,2.98-2.98,2.98h-8.89c-1.65,0-2.98-1.34-2.98-2.98v-8.89c0-1.65,1.34-2.98,2.98-2.98h8.89c1.65,0,2.98,1.34,2.98,2.98v8.89Z'/%3e%3c/svg%3e)


